Using a story wall to add learning
A story wall helps us to focus our attention on the present, by allowing us to take a snapshot of the state of our work at any given moment. Doing so allows us to see bottlenecks and priorities and generally take better control of our work in progress.
But in my last article, I mentioned that we can extend the use of our story wall to help the team apply “second loop learning” as well as managing their daily work. The second loop of learning helps us to look at our processes and think about why we have them and how we can improve them. In this article, I will show how a story wall can help you park information and then group it to observe larger patterns and learnings. Doing that will partially enable second loop learning and also support continuous improvement.
There are (at least) three simple approaches to doing this:
- Adding an extra row to the story wall;
- Adding an extra column to the story wall; and
- Sticking stories onto a second “learning wall” to look for issues and opportunities that are common to multiple stories.
Adding a row to the story wall
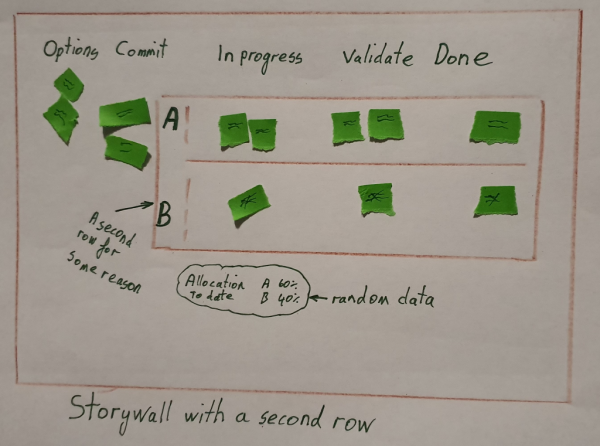
Some teams have multiple rows on their story wall. Perhaps a row for each team member or a different row for project work and BAU. However, it is also possible to have the second row as the “second pass” or “do-over” row. This additional row sits empty where things are working well, but comes into play when a story needs more work after it was allegedly finished or when the team find defects.
For example, team “A” release their features into production on Monday, but customers discover issues or make support calls. The release is placed in the second row and the team track the issues that were found as normal stories.
At the end of the “sprint” or warranty period, the team bring the "done" stories from the second row into their retrospective and discuss how they might improve their delivery of new stories to anticipate and reduce the issues that occur in production.
Team “B” do something similar but they use the second row for stories that fail in testing before release. They move the story to the second row and pass it back through each stage to re-assess, re-elaborate and re-code the story.
They can then focus on clearing the “defective” row before adding new work, which is nice, but they can also review the stories in the “done” column in their showcase and retro. They can assess the percentage of stories that failed in testing and also discuss what caused those failures. The aim, of course, is to also identify the reasons stories ended up in the second row and then identify ideas for reducing defects in the future.
Team “C” do not use the second row as a second pass lane but rather as a special story lane. When they commit to a story they choose to put the story in either the standard lane or the learning lane. Most stories go in the standard lane, but stories that involve single point sensitivity or special skills that some team members want to learn to go in the learning lane.
These learning stories are treated differently because the team has agreed that they will slow down to let team members learn as they work on them – perhaps there is more peer-reviewing, pair programming or even training and walk-through sessions as the work is done. Doing so highlights the capacity of the team for additional learning and also allows the team to consciously commit to learning on stories, taking longer to get work done today in order to build resilience for tomorrow.
Adding a column to the story wall
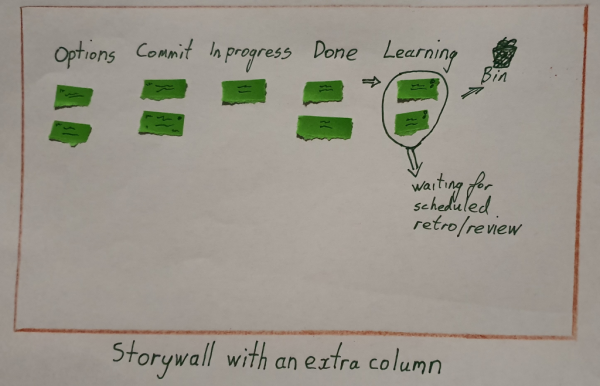
Rather than adding a second pass row, the team can add a “learning column.” This is where stories go when they are completed but there might still be something to discuss.
For example, team “A” might put a sticker on stories that the team want to review. Then when the story is done it moves into the “learning” column to be reviewed in the next retrospective. Team members can explain why the story is there and what they want to explore – maybe the story bounced around between columns or failed testing several times, or maybe it just sparked curiosity.
Team “B” might leave all their stories in the learning column for 10 days after they deliver them to clients. After 10 days they survey their clients and then see if there are additional things to learn while the story is still new and fresh in the client’s mind. These learnings then feedback into the team’s approach for future stories.
While both the extra column and the extra row are easy on a physical wall, the extra column is probably easier to apply with an online story wall.
Team “C,” however, go a step further. They regularly take the stories from the learning column and move them to a separate “learning wall.”
A learning wall

Perhaps the team take all their defects and put them up on the wall, or perhaps they add any story that promises further learning. The team put all these stories up on the wall without worrying about priority or structure.
Next, they take a step back and look at all the post-it notes. They group them into whatever categories they like and then look at patterns. You can follow this link to find instructions for doing this as an “Affinity diagram“.
Once the team see patterns then they can simply talk about what do with their new information. For example, if there are a lot of issues for smaller clients then this might alter the discovery and analysis work the team does.
Perhaps the team only do this every few weeks or perhaps the clumps of stories stay on the wall and people review the new learning stories each week to see if they fit into existing clumps or create new groupings.
But seeing clumps of information might not be enough. The team might wish to move to action.
In my rough diagram, the team are using a “CIA table“, which they teach in kindergarten, to look at what they can do. They grab one clump and then look at what they can control, influence or accept.
They might also use a “how might we” table, an “illness approach” or even the forgotten, complex but fun cause-effect clock.
Some teams go even further, using ishikawa cause-effect diagrams and pareto diagrams to be more scientific in their observation and learning. But you can look elsewhere to cover off those approaches. Once you do though, you can still start simply by taking stories from your learning column (or row or wall) and then stepping back to learn more from the stories as a group than you would looking at them as individual events.
Conclusion
All of these approaches involve a little more work, but you can experiment with them cheaply and you might find that they make new learning available to the team. You might also find that there are constraints and assumptions that you have been making that, once they are visible, are worth challenging.
So don’t commit to doing them forever, just adopt one approach and try with your existing retrospectives to keep them fresh. Then see what happens next.
Posted by James King
Copyright © James King
Thank you!
Your details have been submitted and we will be in touch.
Thank you!
Your details have been submitted and we will be in touch.